
You started off today as a seasoned pro in the marketing world, looking for smarter strategies to reach qualified customers. Maybe you’ve heard about analytics tools, but haven’t had the time to use them because they appear too hard to learn, and you're too busy generating “leads.”
Now, imagine you are a fisherman, and need more fish. “Rusty,” your trusty fishing rod, is failing you—hook, line, and sinker—so from your pit of desperation, you scheme up a new strategy:
1. Find the world’s biggest boulder.
2. Haul it to the edge of a huge cliff.
3. Hurl that sucker down at the body of water below, with laser sharp overhand precision.
"Wow," you say to yourself. "What a splash!" But, how many fish did you catch?
No sane professional fisherman (or woman) would choose the “Boulder Toss” as their go-to fish acquisition model. Would they? Serious question: how strategic is that strategy in achieving your ultimate goal of acquiring more fish? And the choir sings in imperfect pitch: It was not reaally that strategic at alllllll!!! But it made quite the significantly insignificant splaaaaaash, though.
Sadly, a similar song can be sung about a boulder-sized portion of our marketing strategies these days.
Tim Lockhart’s famous book “Stillwater Simplified” offers to interested readers “practical lessons to help you catch more fish on the fly, using timing, strategy, patterns, and other hacks.” If you had read his book, you probably wouldn’t have found yourself at the beginning of our story, at the edge of a cliff, splashing water and wishing for fish.
If your current marketing strategy follows a similar “Boulder Toss” type model, this article will show you how a few simple analytics tools can save you from the “splash syndrome.” Just like Tim’s book, you'll learn how to use behavior data, timing, and patterns to inform your strategy. It’s about time you start actually catching some fish.
No more “Go Fish” guessing.
The key to catching fish is combination of knowing where they are, what they eat, and how they like to eat. The same can be said about getting qualified leads, and your analytics tools help you figure that out. In this blog, I’ll show you how a few cool tools like Google Analytics, HubSpot Analytics, and SEMRush can improve your inbound strategy.
Behavior Data: For "seeing underwater.”
My favorite, and only, fishing experience was on a boat dock on a private island in Bermuda. The water was so crystal clear that I could literally see all of the colorful fish swimming, and see which ones actually liked turkey bacon. Analytics tools help you understand your audience in the same way. They provide useful info on how your audience organically engages with your brand and its messaging.
Example:
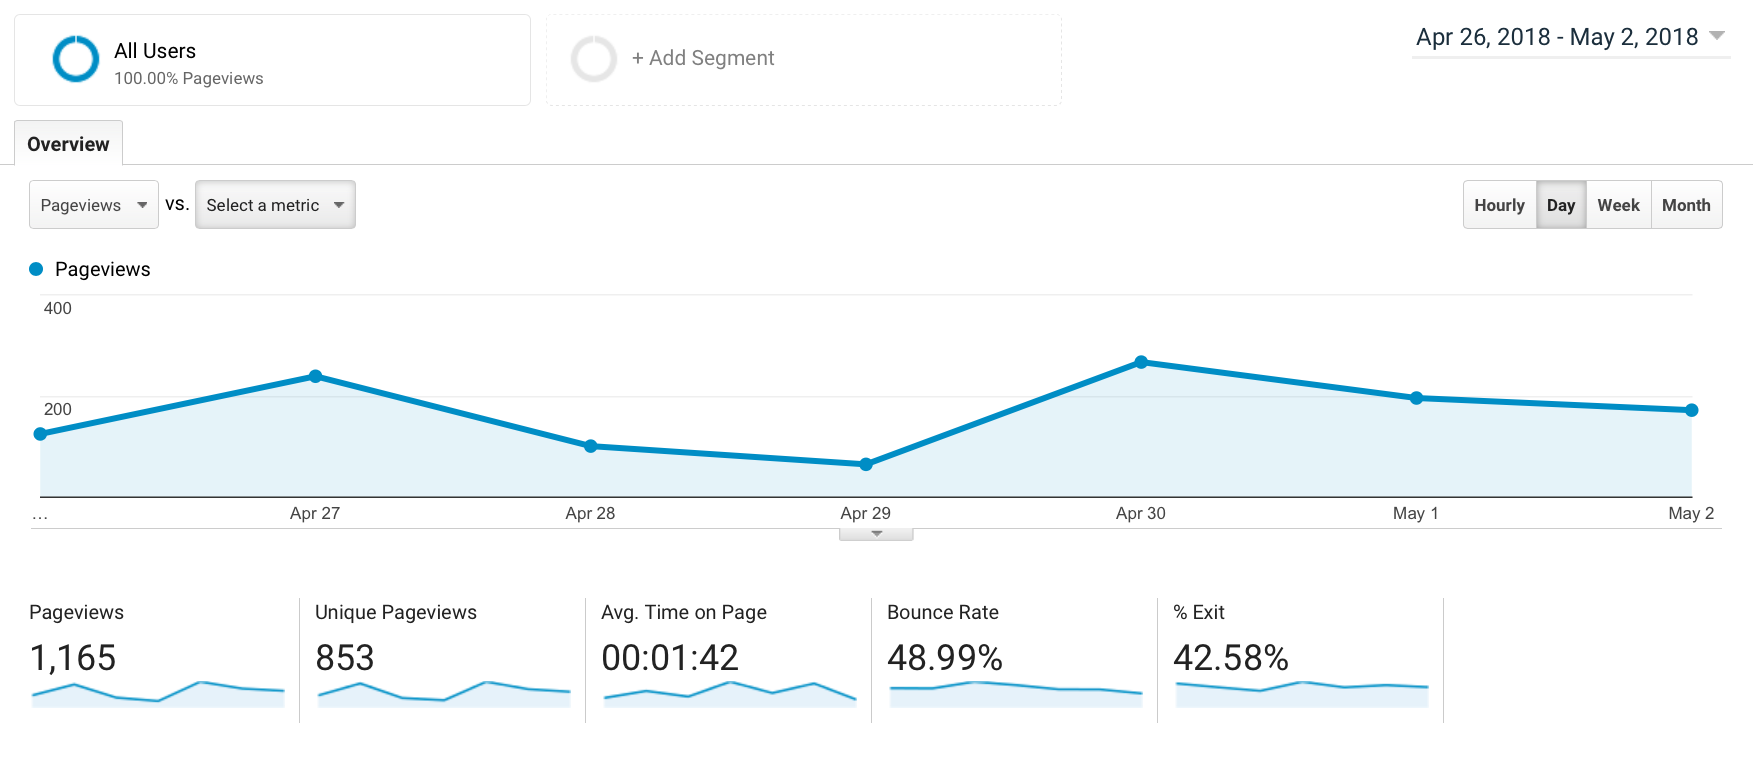
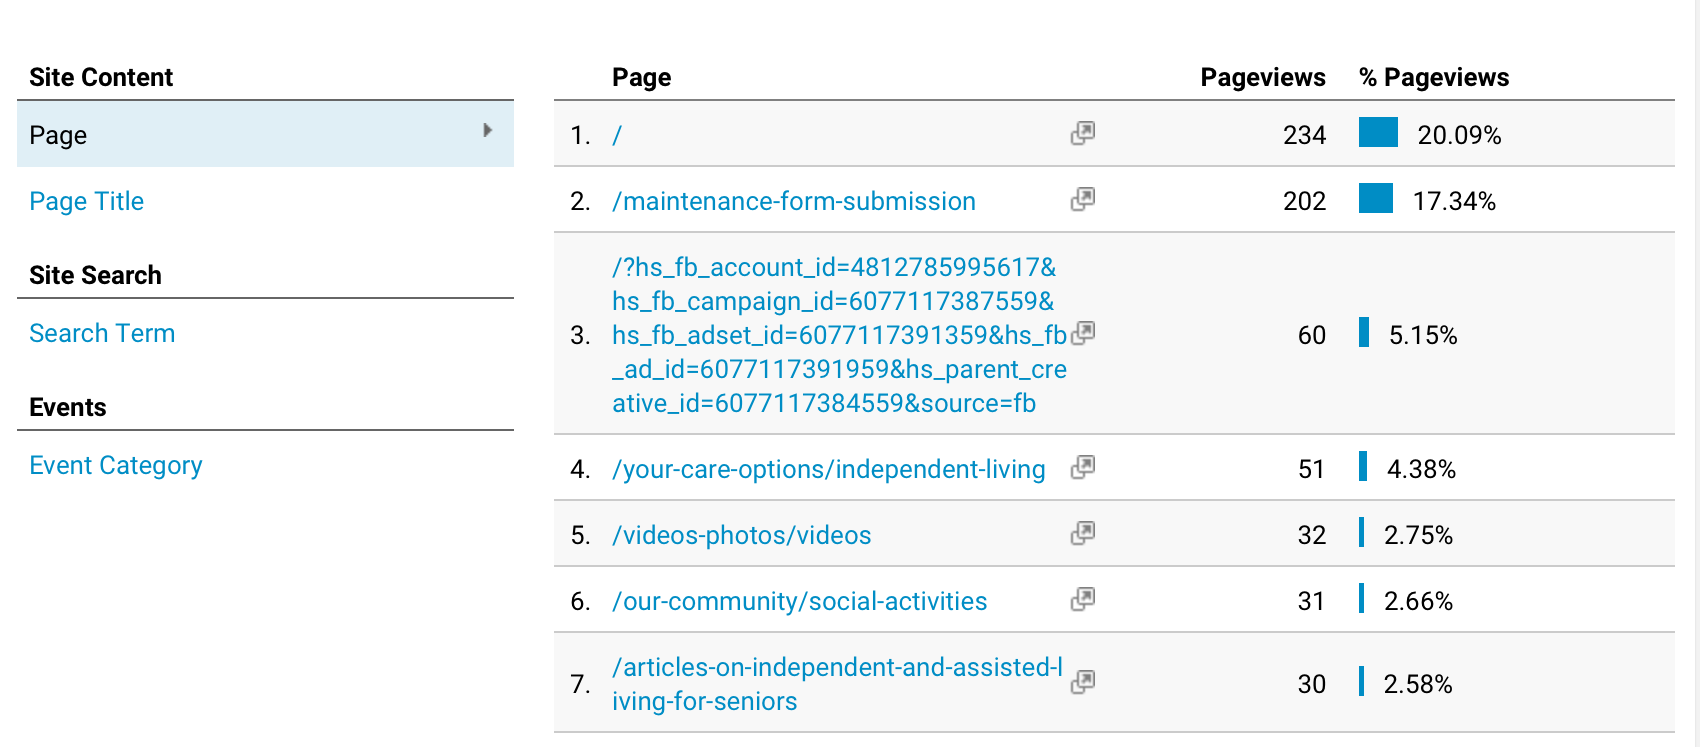
Google Analytics has a really cool Behavior Report that shows you which pages on your company site are getting the most views, the average time visitors spend on these pages, and the percentage of visitors that exit the site from that page. Use this information to assess the content on these top-performing pages, and strategically refine your marketing campaigns to intentionally align with those engaging elements.
Timing: “Only bait when they're biting.”
Timing is everything. No matter how sleek your rod, strong your net, or scrumptious your bait, if you’re not fishing when your fish are hungry, they won’t bite. Get your timing right. There are sites that tell you the best times (and tides apparently) to fish; analytics tools can help you know the best times to reach your customers.
Example:
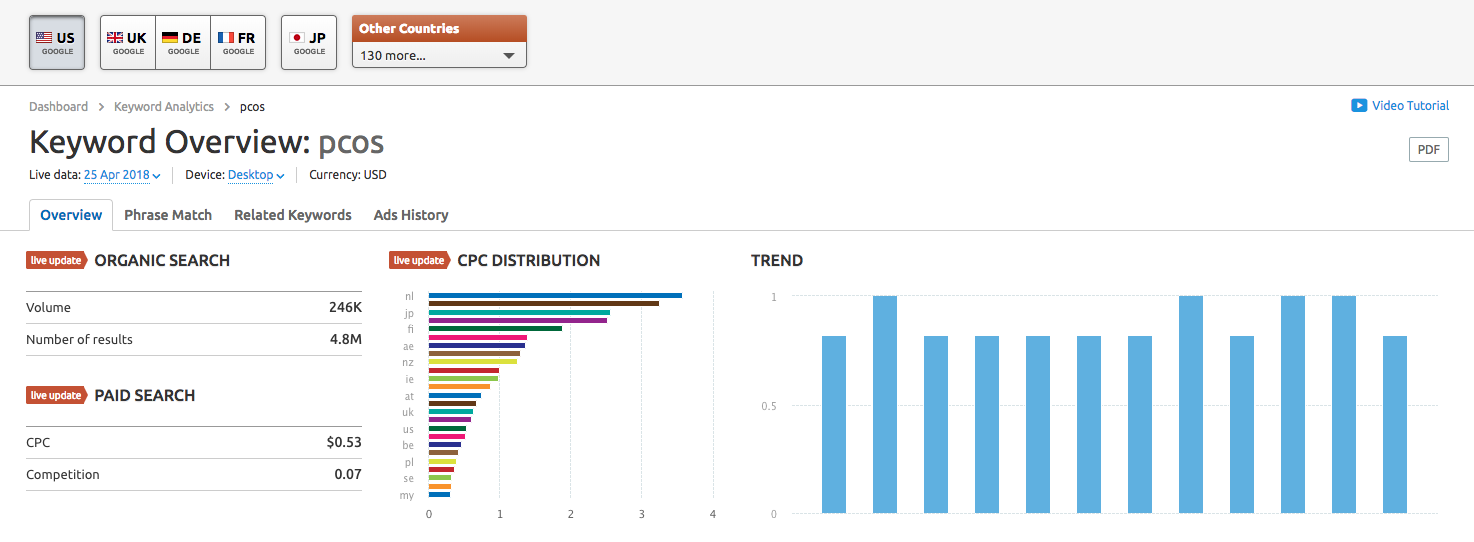
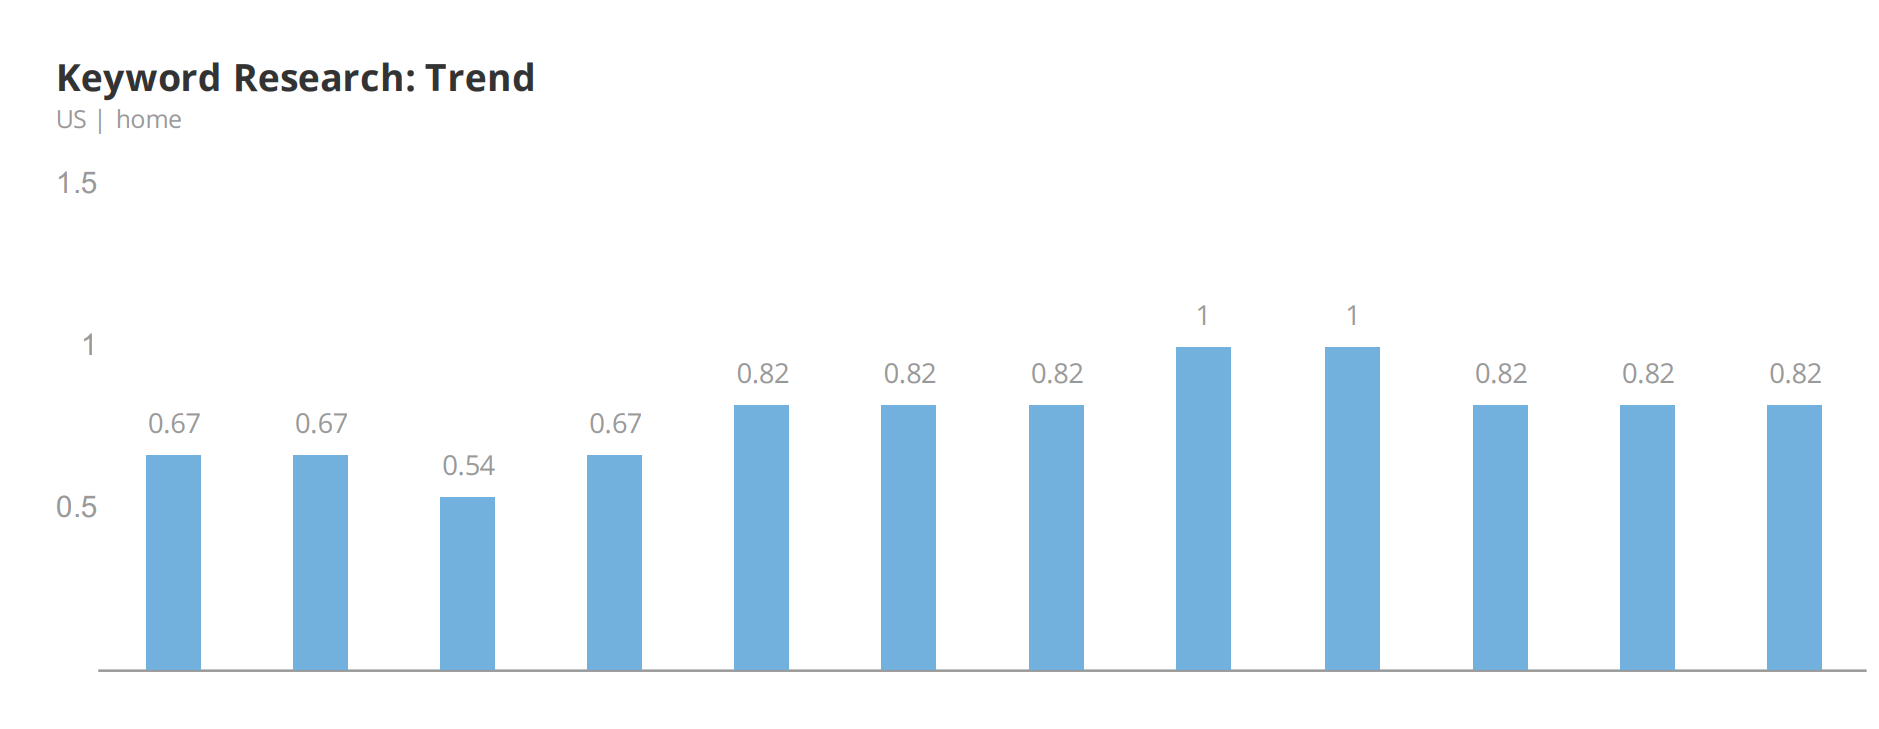
SEMRush has a cool tool called the keyword trend map that, with the click of a button, shows you which keywords your potential customers are typing into search engines that land them on your site, as well as which specific months of the year those words are being searched most frequently. Use this insight to select your choice words, structure your campaign, and strategically schedule content to align with the trends you’ve observed.
Patterns: Synchronize it like swimming.
I'm thinking back to the boat dock in Bermuda, gazing down at the sea of beautiful creatures below. At first glance, that mixture of aquatic movement could be mistaken as random, but a deeper dive reveals that each fish is actually moving to a very specific and intentional group rhythm, kinda of like different synchronized schools of… thought, because fish think, as do your customers. Use analytics tools to see your leads, personas, posters, and posts more as an organized symphony of diverse movements, and less like a cacophony of confusing communication.
Example:
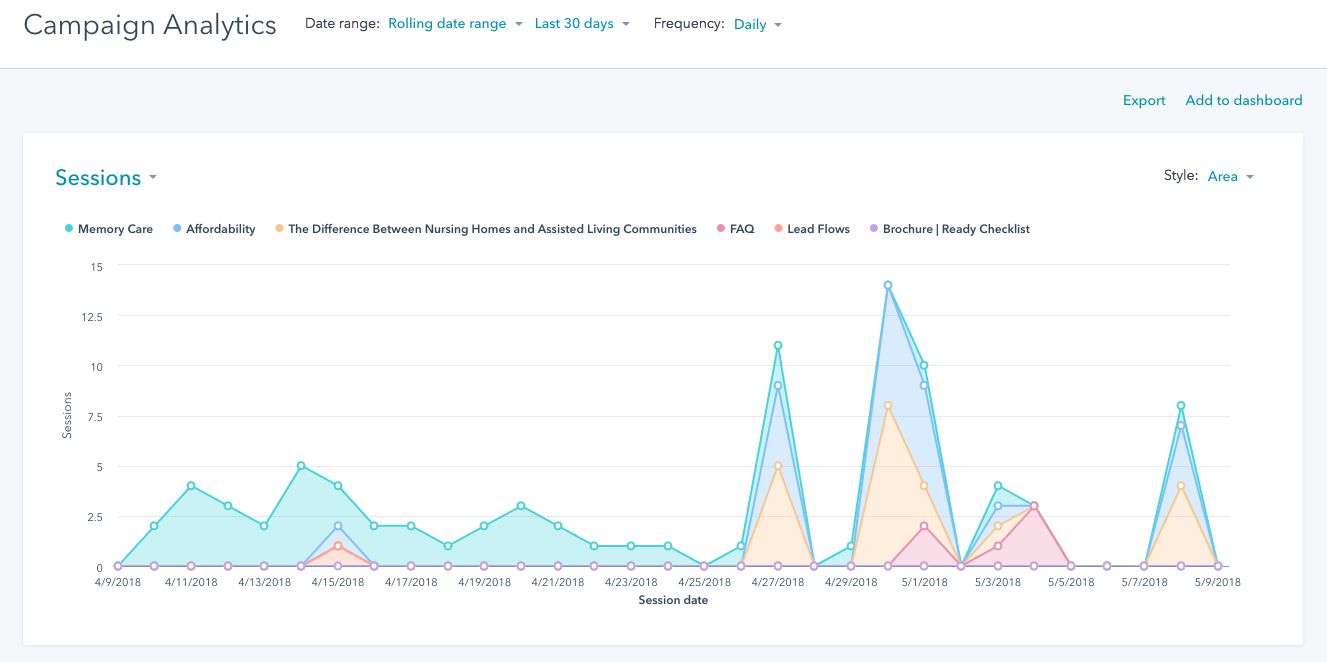
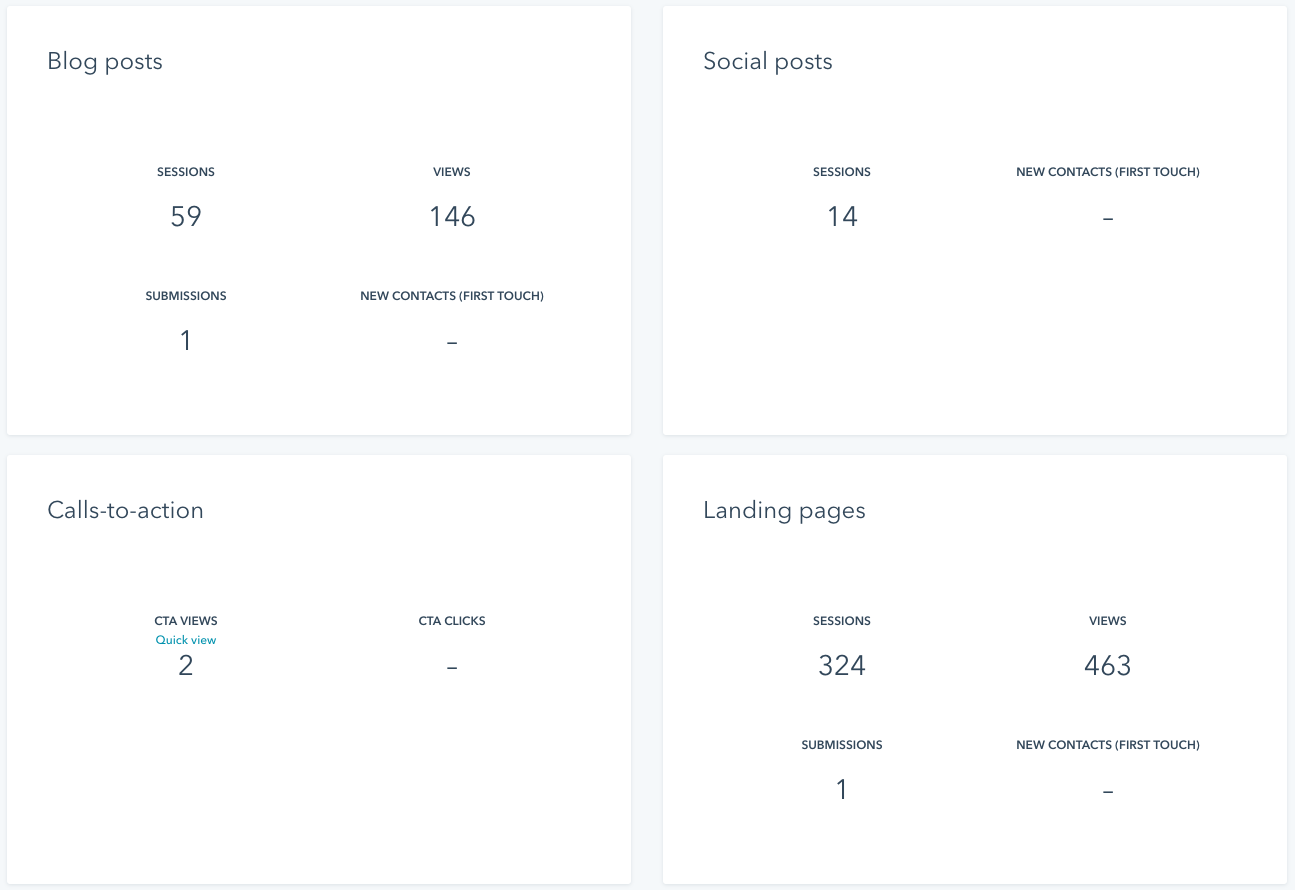
Finding patterns across your campaigns and their associated elements helps you be more effective with your inbound strategy. HubSpot is a powerhouse of a tool when it comes to synchronizing your many moving parts, and its analytics tool gives a clear view of the grand orchestra (since you are now also a composer/conductor). Music to your ears. Use the campaign analytics tool to zoom out and assess the performance of all of your active campaigns as dynamic units of your overall marketing goals, or click on a particular campaign to zoom in to assess the performance of each particular moving part (emails, landing pages, social posts, etc.).
Bringing it home: “Teach a man to fish...”
OK, so now you’ve learned how to use behavior data, timing, and patterns as tools to fish smart, and market smarter. Less “boulder tossing” and more analysis. Less “go-fish” guessing, and more “fish in a barrel.” Less splashing and more catching. Agreed? Now, go feed a village: your business.